Network Graph
Advertisement
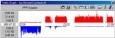
NetGraph - network monitor v.2.0.4.23
The NetGraph - network monitor 2.0 is a software network-monitoring program that enables users to see at a glance the activities on their networks including the volumes of traffic with four simple graph mode indicators.
Advertisement
Task graph generator v.1.0
Create task graph with this application. TaskGraphGenerator can be used to develop task graphs that are needed for research works in areas of task scheduling.Task graphs are generated based on 4 algorithms.
YEd Graph Editor v.3 8
yEd is a powerful diagram editor that can be used to quickly and effectively generate high-quality drawings of diagrams.
NetPalpus
NetPalpus is a powerful and easy-to-use network management tool, which can discover, organize and monitor all devices on your network. It can monitor the device status, as well as availability of specific services and alert you via sound or email when a
Lens v.1.0
Lens is a powerful and easy-to-use network management tool, which helps you to discover, organize and monitor all devices on your network.
Drishti v.2.0
Volume Exploration and Presentation Tool. Drishti stands for vision or insight in Sanskrit, an Indian language. This software provides facility to animate transfer functions, animate volumetric time series, animate sub-volumes,
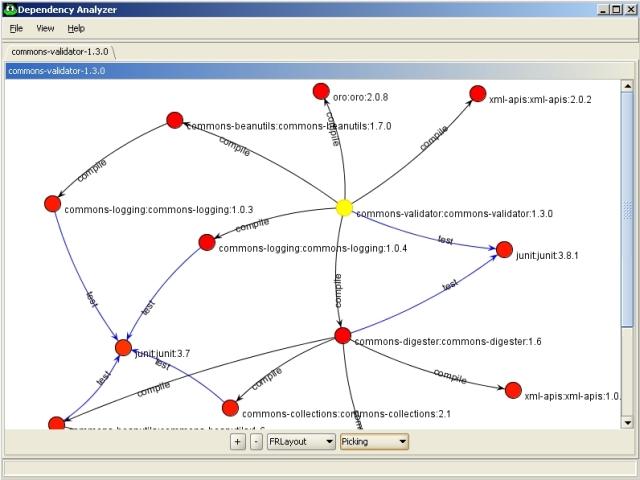
Dependency Analyzer v.1.1.rc0
Dependency Analyzer is a utility for visualizing Maven2 dependency graphs.
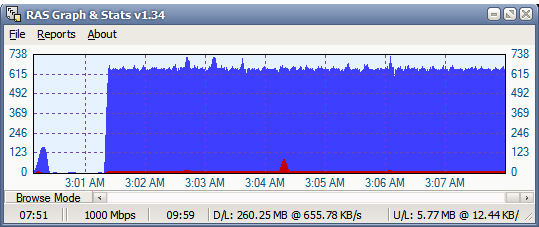
Traffic graph
Traffic Graph is a network analytic tool that examines local area network usage and provides a display of upload and download statistics. The main puropse of the application is monitoring (and counting) the IP traffic between your local area network (LAN)
CoSBiLab Graph v.1.0
Graph constructs, visualizes and modifies graphs as well as calculates measures and layouts. CoSBiLab Graph can construct, visualize and modify graphs as well as calculate measures and layouts.
Easy network (LAN) monitor Galileo 2007
Local area network monitor Galileo 2007 is a tool to have a bar graph view of the performance of a network using ICMP Ping. The application Shows numeric data about round trip time, data loss percent, time stamp of the event where a host did not